runBenrun – These aren’t Heat Maps

I’ve gone back into my running data from 2014 and 2015 to build some density maps to compare to what I have run so far in 2016. Building a 10m grid for the region, I did some simple aggregations based on the GPS points captured by my Nike+ watch and processed through my runBENrun project (see it here on github).

These aren’t heat maps.  These are simple density maps.  There is a difference.

<start rant>

Please stop calling every single choropleth map a heat map.

</end rant>

From my running data, I can see some pretty clear patterns in where I ran.  In 2014, I kept my runs in Winter Hill, but ventured out into Cambridge and Boston a few times. A couple races in Boston show up, but the blue color range is only for a couple points per pixel.
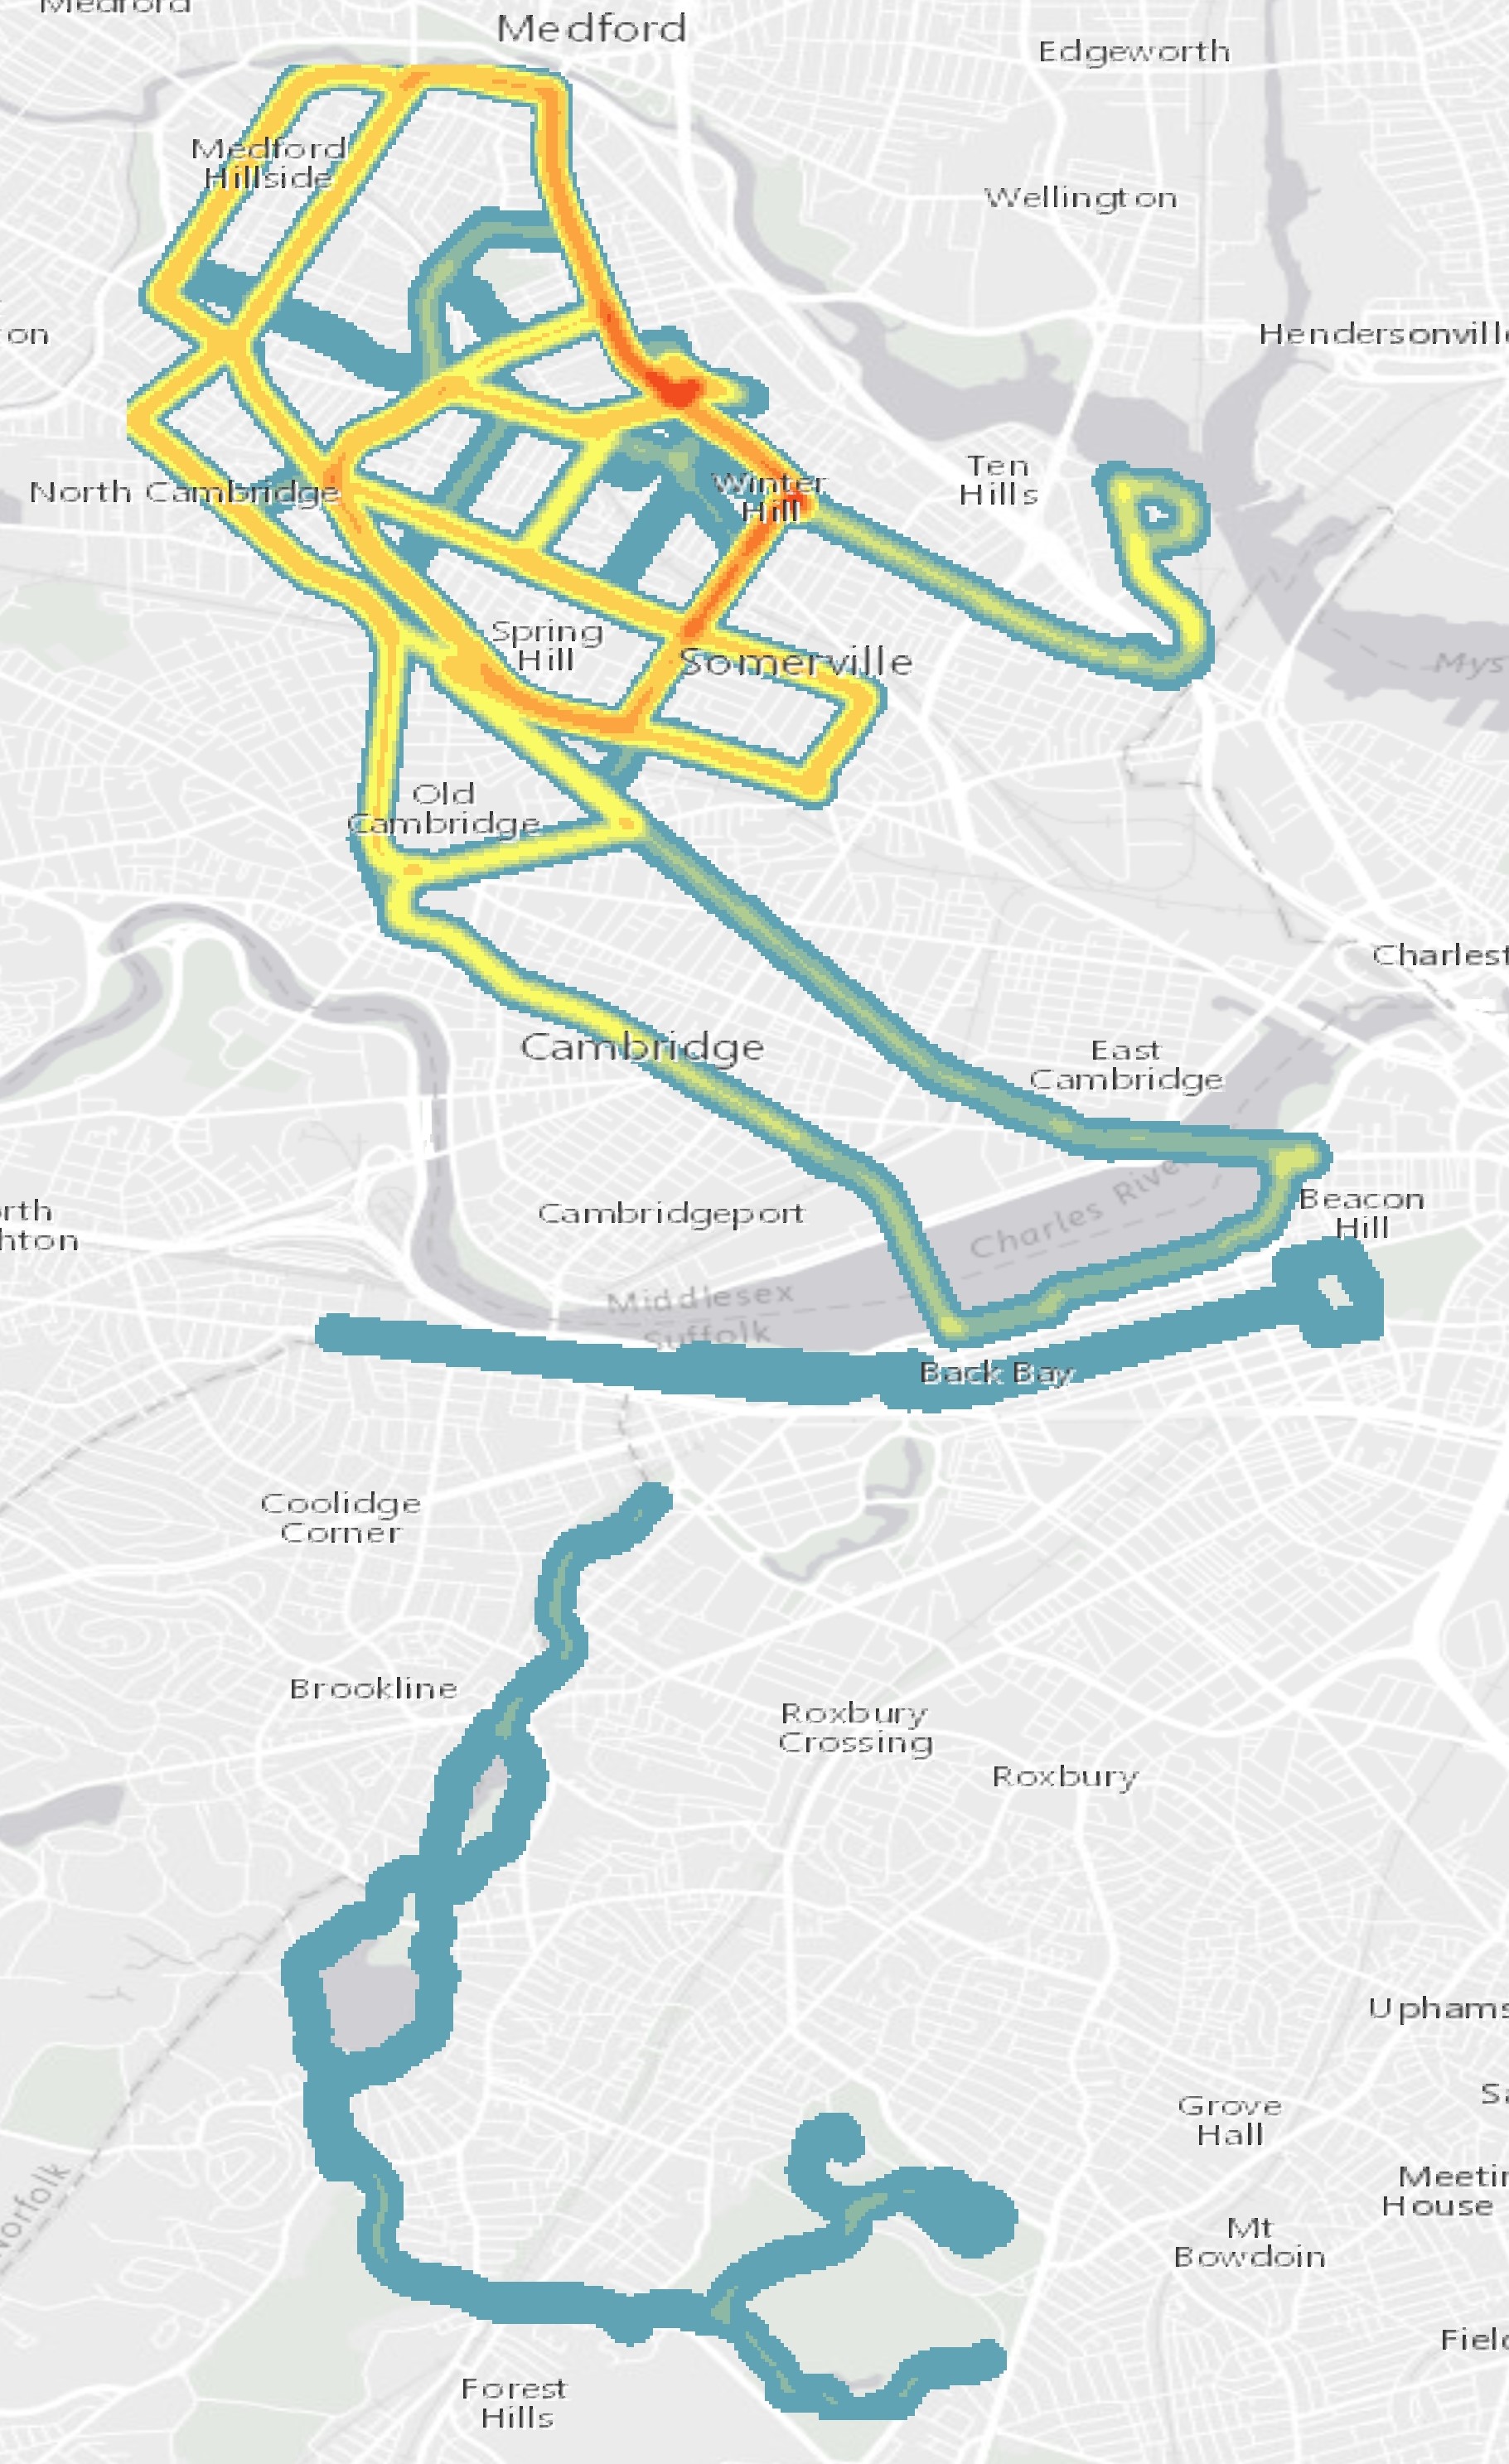
2014 Run Density
2014 Run Density

In 2015, I changed the geography of my runs. I stopped with my Winter Hill routes and went out to the Minuteman Bikeway, venturing out as far as Lexington. The darker reds indicate where most of my runs were. Again, a race in Boston stands out as a single run, as do a couple runs into Medford and the southern reaches of Somerville.
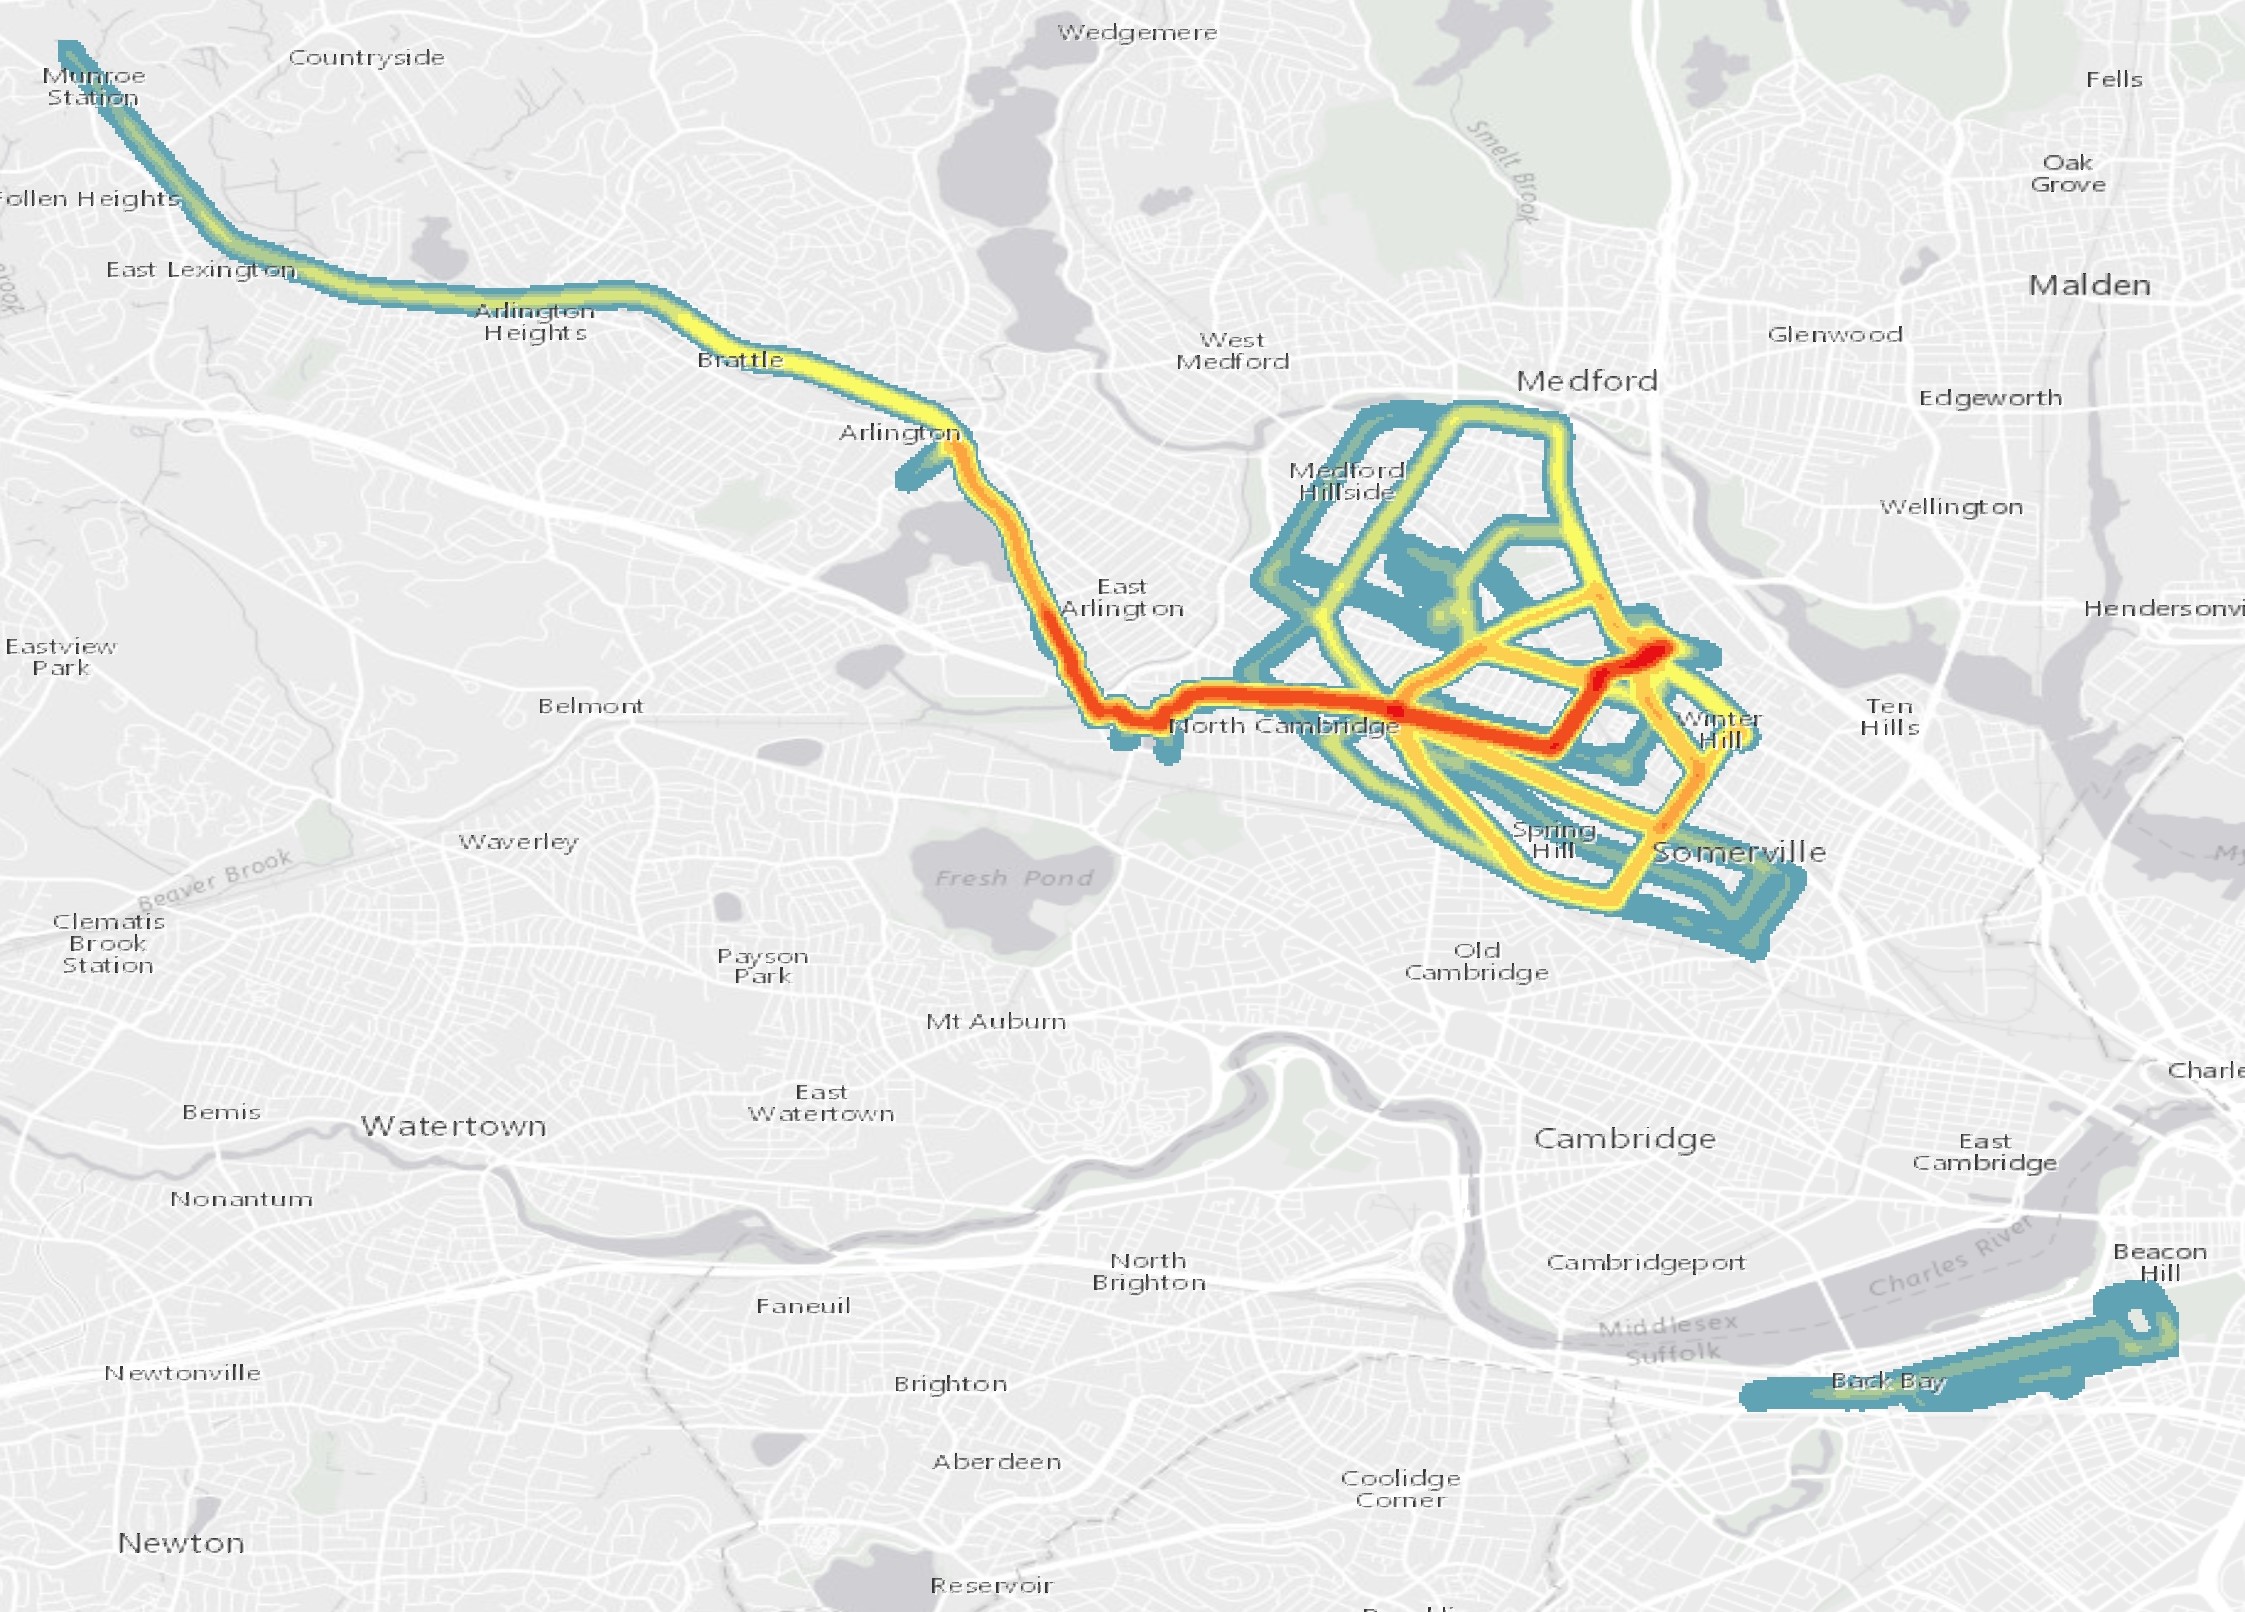
2015 Run Density
2015 Run Density

My 2016 run density map to date is much different than the previous two years.  Firstly, I have put on a lot more miles this year than in past years, but almost all my miles were on the Minuteman Bikeway! I did run quite a bit into Cambrigde and Boston, mostly on my long Sunday runs as I prepared for my marathon. Like 2015, a vast majority of my runs were in Somerville and Medford, along the bike path.
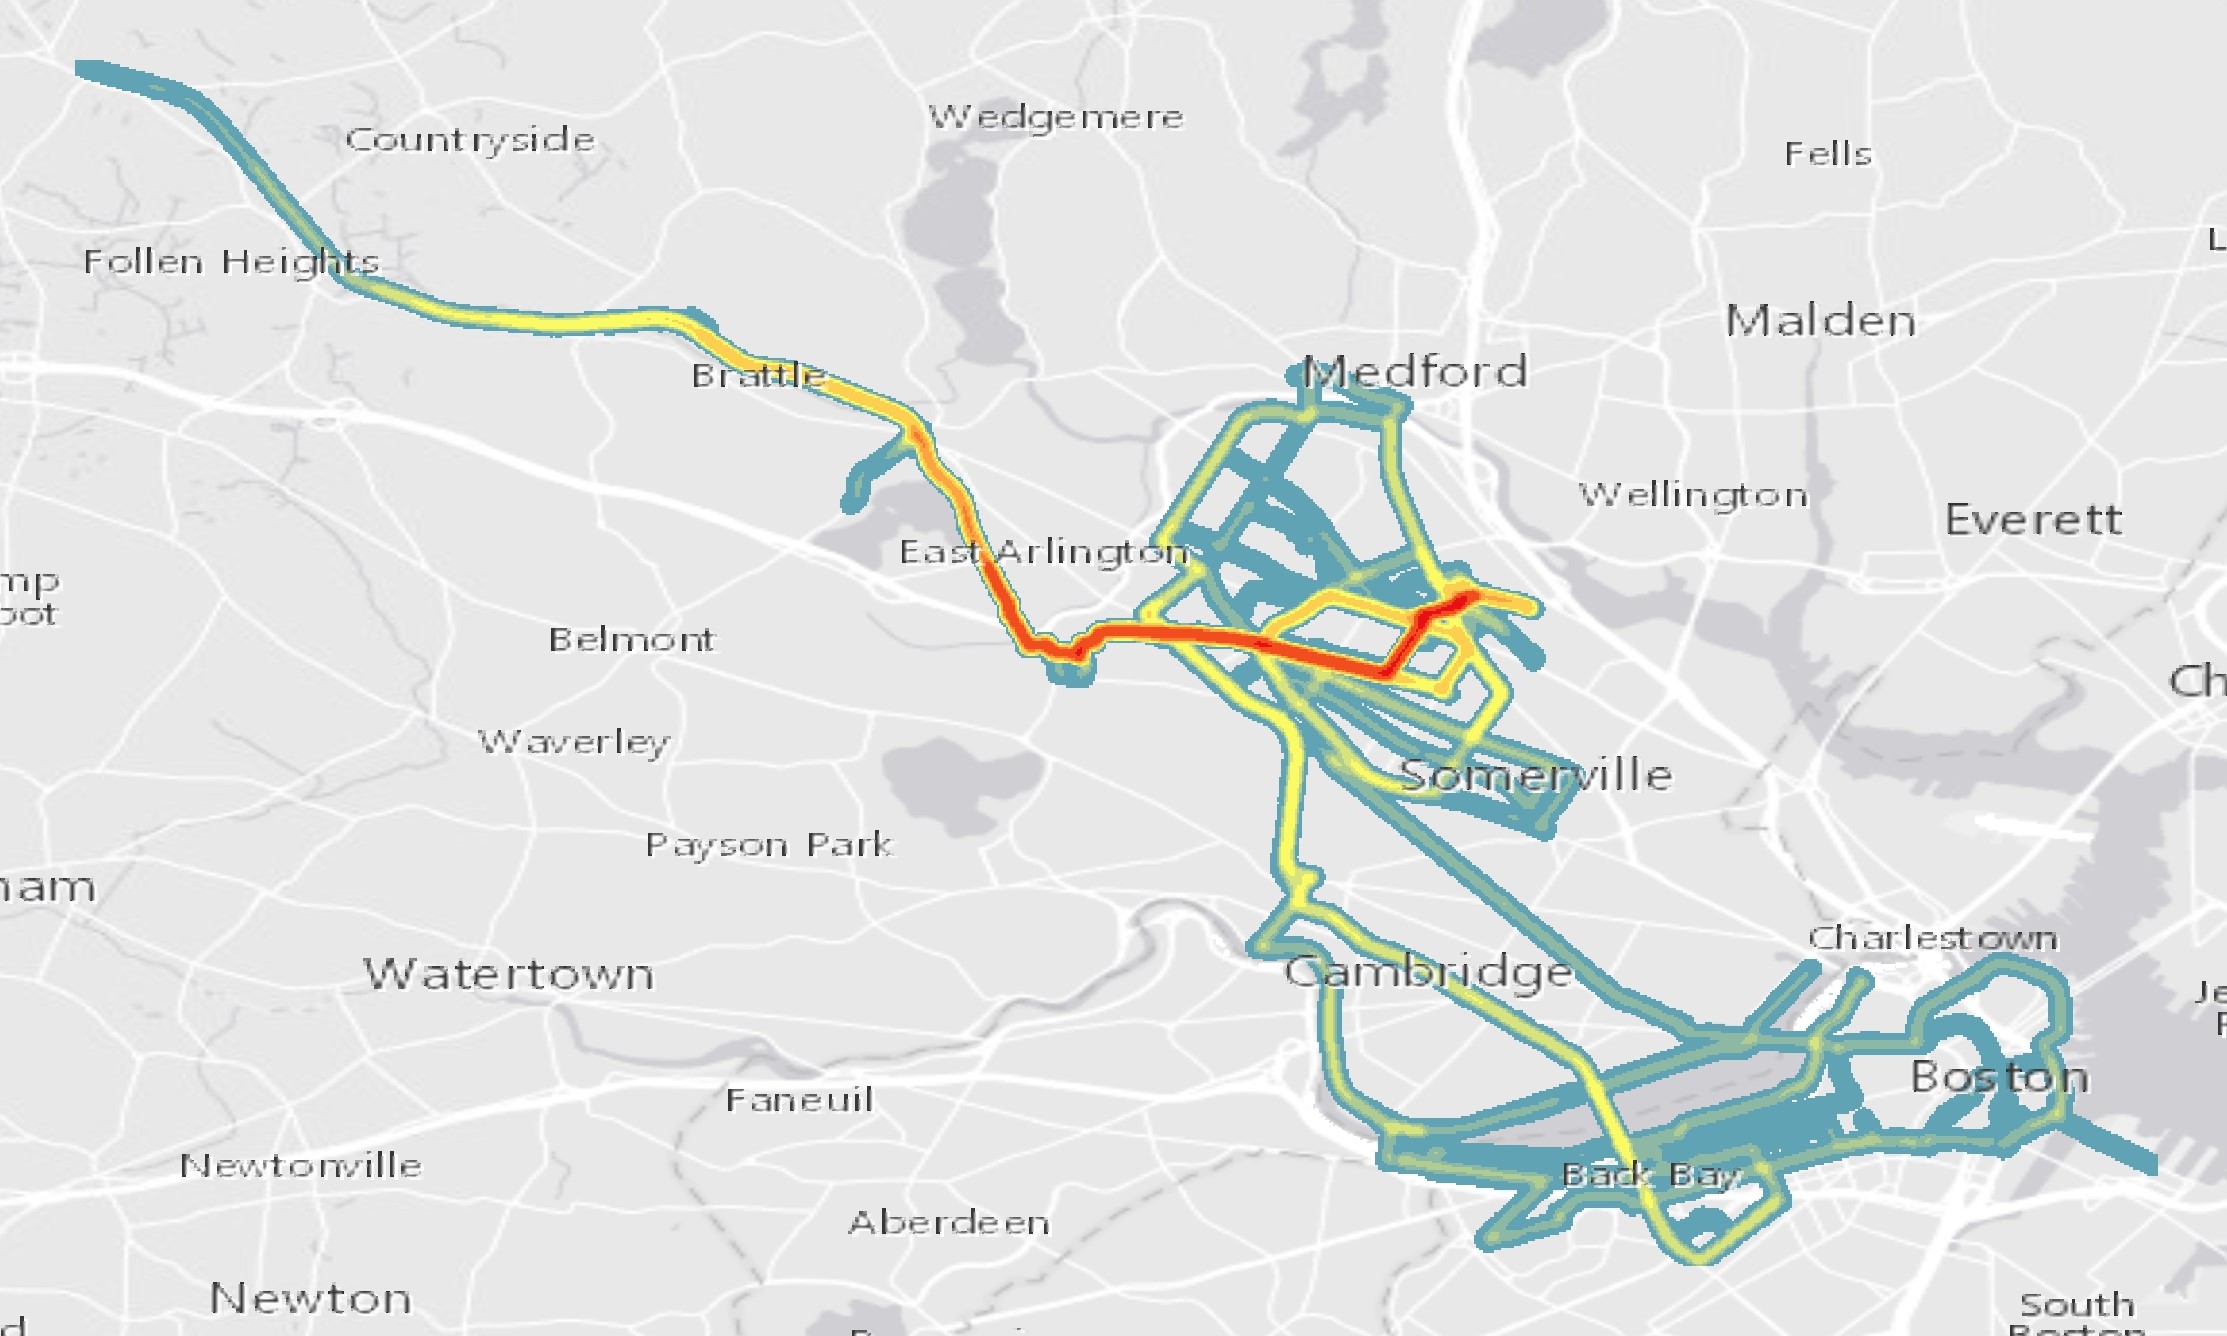
2016 Run Density
2016 Run Density

When I combine all years I get a view of my running history that I have developed quite the habit for running close to home! The runs along the Minuteman Bikeway radiate red, as I have logged hundreds of miles along the route over the past couple years.  Even my adventures into Cambridge and Boston start to stand out, as I tend to use the same routes down Mass Ave, Boylston Street, and back into Somerville and Medford along Broadway in Cambridge.
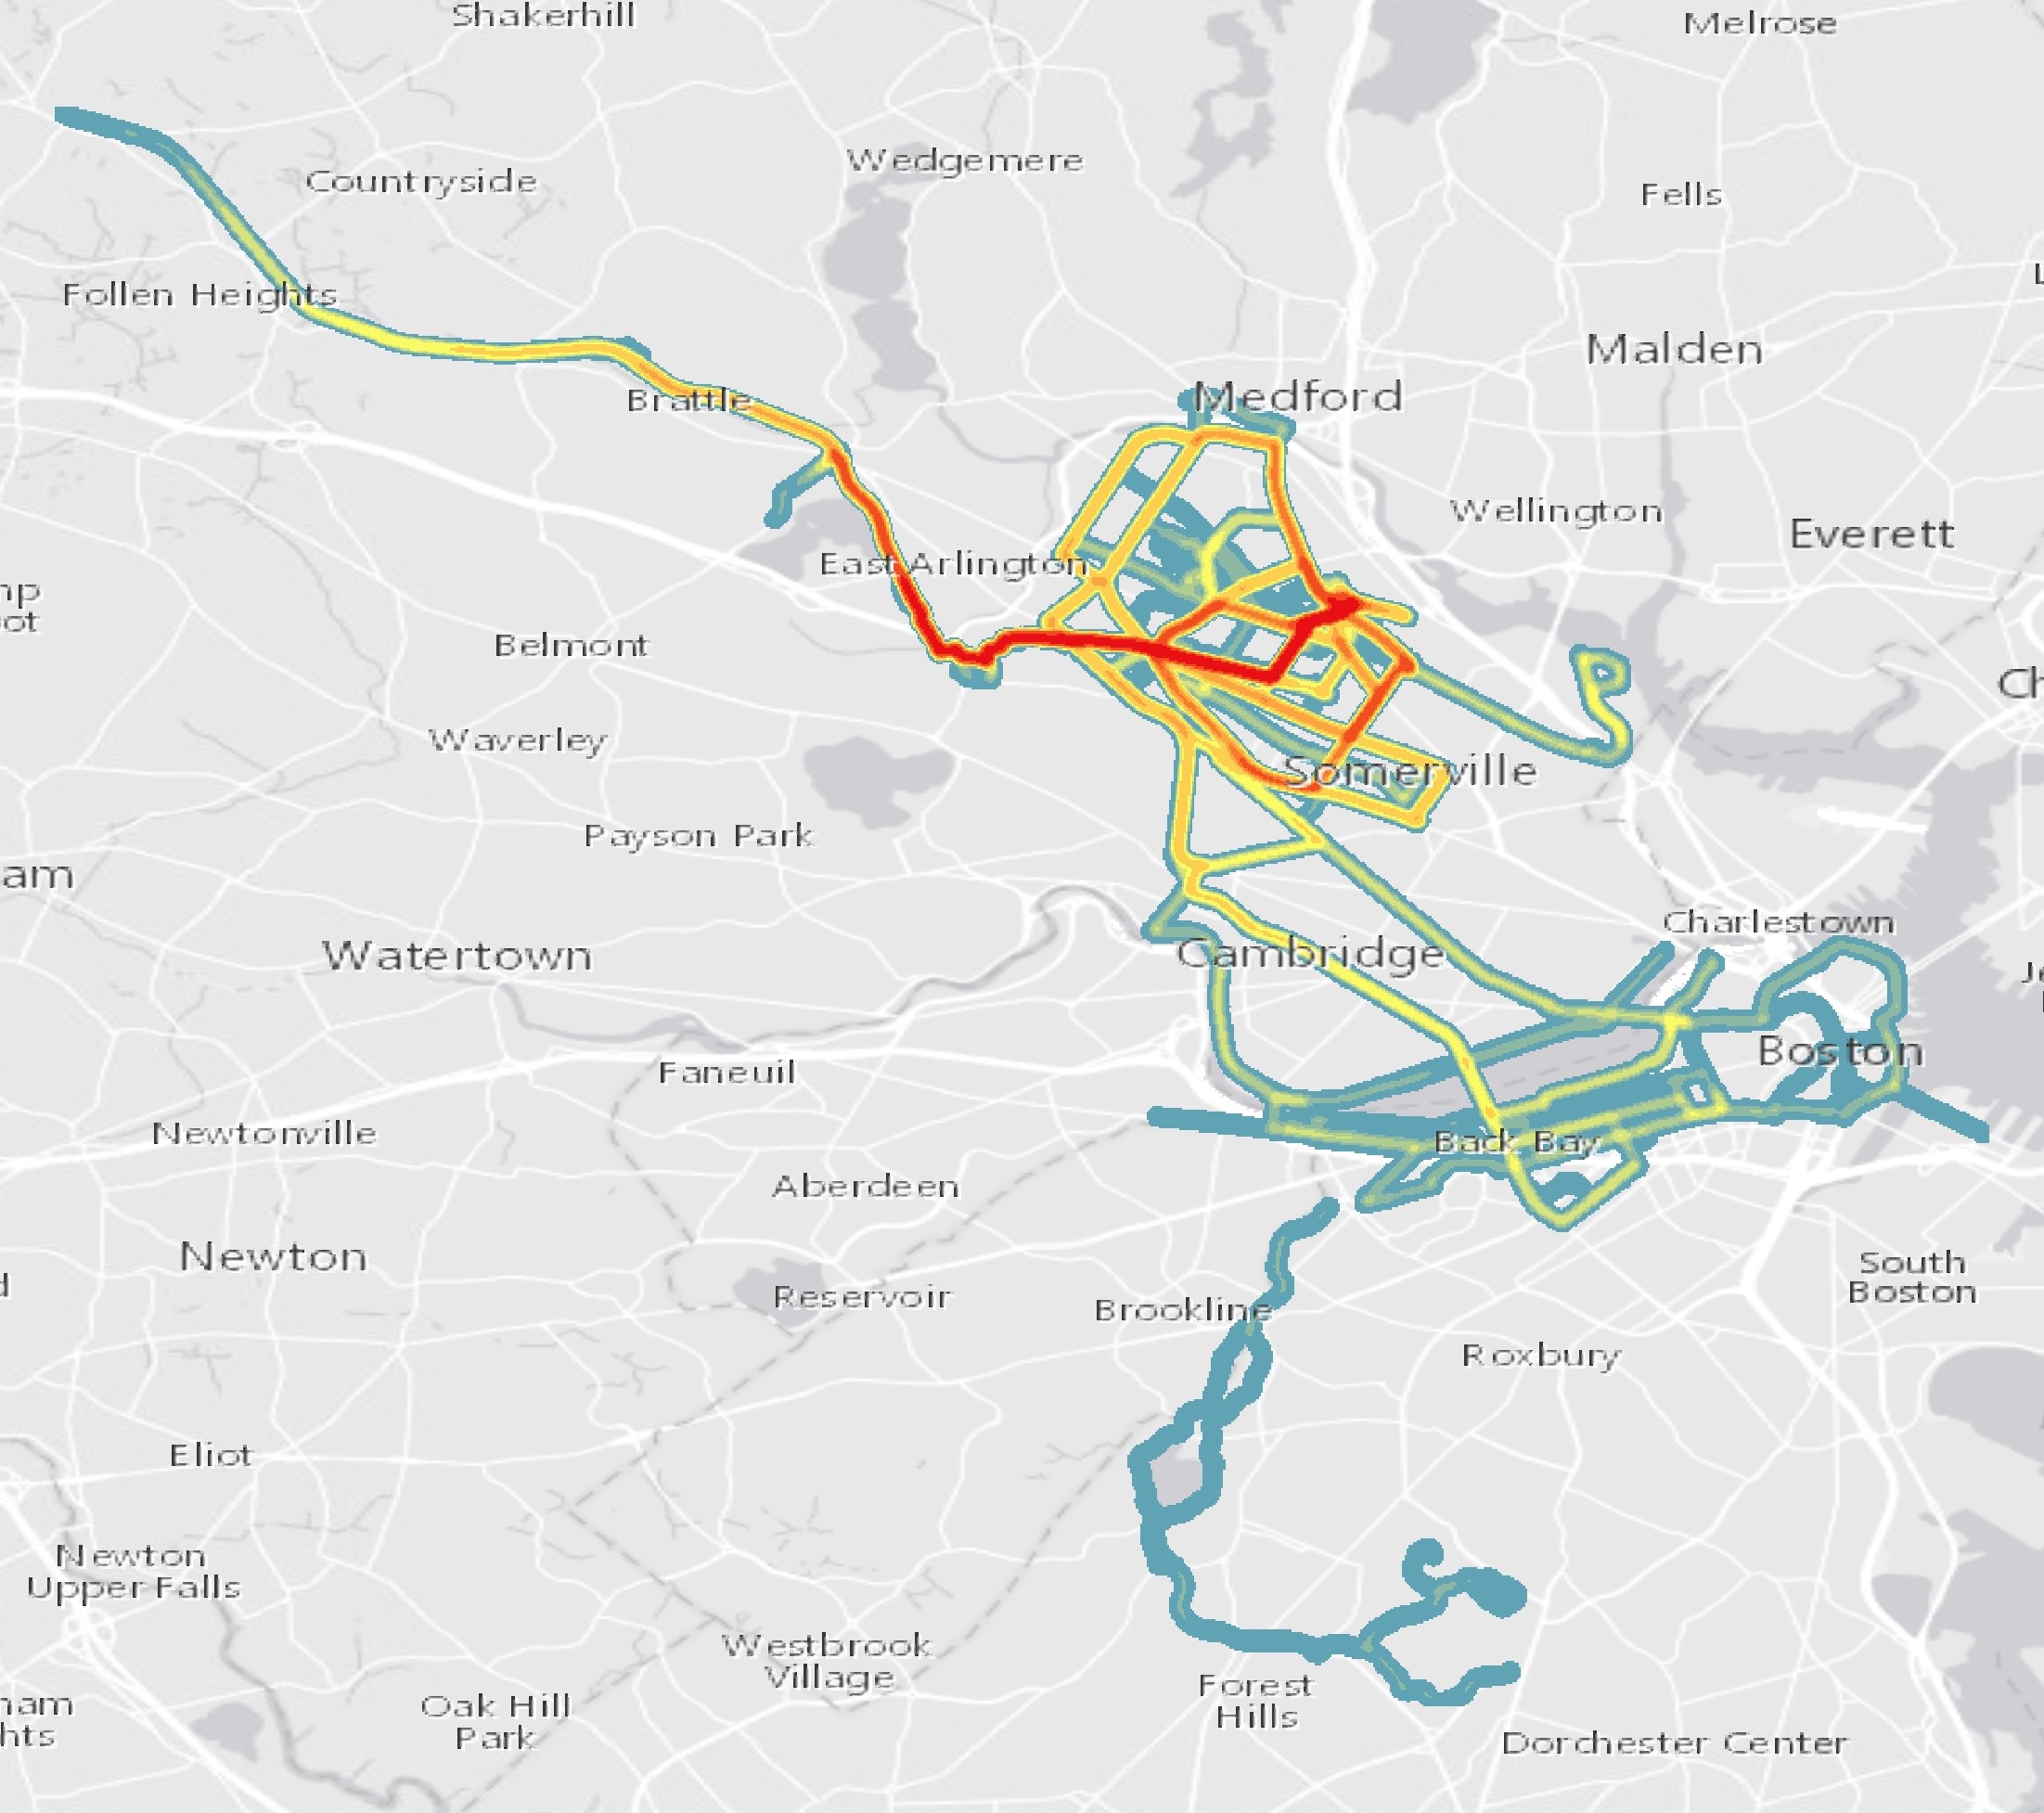
All Run Density Map
All Run Density Map

This exercise didn’t reveal anything new to me, but it was a good exercise in thinking about different ways to display the data collected from my Nike+ watch through my runBENrun project.
It’s 2016 and I Want to be Better at What I Do

Welcome to the future, 2016. It’s nice to meet you.

2015 was a great year.   I did a lot of cool stuff, and almost all of it wasn’t geo-related.   Seriously, like 95% of the things I did this year had nothing to do with geo or GIS.  That’s all fine and good, but I really love geo. I went to school for a long time to just kinda give up on it in the past year.

During the last few days of 2015 I made a list of things I want to do in 2016.  The list is fairly short. I want to start to learn Mandarin Chinese, become a better runner, read more, remember my passwords to stuff, and get better at what I do.  Geo is “what I do” and I really want to get better at it in 2016.

I know the path to meeting a couple of my 2016 goals, but how do I get better at geo? I’ve been working in geo for almost 10 years.  I have a job that allows me to challenge myself on a regular basis, and do a lot of geo work.

In this case, I think the path to getting better is by doing more. Practice makes perfect. In 2016 I will strive to create more maps, tools, algorithms, datasets or anything else.  This, I hope, will force me to learn new skills, hone my existing skills, and inspire me to try new things and test new ideas. I won’t just leave ideas written down on a post-it note on my desk.

I will make some maps from those ideas I have written down, post tools and code I create to my deserted github account, write more technical and research/analysis GISDoctor.com posts (even if they aren’t any good), contribute to my local geo-community, and make a real effort to add to OSM more than I have in the past.

By doing more, I think I can keep challenging myself to expand but also refine and tighten my geo-skills. More importantly, I will keep myself motivated and interested in geo! I’ve definitely already put the first 10,000 hours in.  Maybe the next 10,000 will really define who I am as a professional geographer and member of the geo-community.

Here’s to what is hopefully the most productive and inspiring geo-year of my life!


In 2017 I will stop over using the prefix Geo.

Long = X, Lat = Y – Free Illustration Included

latlong_final
Feel free to use this everywhere. Print it out and hang it on your wall.

My biggest geospatial pet peeve is when people confuse the relationship between x/y and lat/long. I believe this is a fundamental concept in geography and I am here to reintroduce you to math you probably learned in elementary school (middle school maybe?).  If you already know the proper x/y-long/lat relationship then you can skip the rest.

First, let’s review the Cartesian coordinate system.  The X axis is the horizontal plane and the Y axis is the vertical plane. Two dimensional.  Pretty simple.

Now, let’s look at latitude and longitude. Latitude measures angular distance from the equator to a point north or south of the equator. While longitude is an angular measure of east/west from the Prime Meridian.

Now this is the important part.

  • Latitude values increase or decrease along the vertical axis, the Y axis.
  • Longitude changes value along the horizontal access, the X axis.

Easy.  X = Longitude, Y = Latitude.  Now you will no longer be confused when calculating centroids or setting webmap coordinates.

Happy mapping!


The Tool Belt Approach

Firstly, it’s been a while since I’ve blogged.

I’ve been busy.

My wife and I bought a two family home in South Medford, Massachusetts a couple months ago. It’s a nice little place, in a walkable neighborhood with access to transit, and it’s only 4.5 miles from downtown Beantown (no one here calls it Beantown). The home, as they say, is a “fixer-upper” and both units need lots of work. My wife and I have been spending every waking moment doing yard work, rebuilding our first floor unit’s kitchen and bathroom, painting walls, doing demolition in our basement, working with our plumber and electrician as they rewire and replumb the entire home, negotiating the city hall permitting process, Et cetera, Et cetera, Et cetera…

During the past couple months not only have I learned a ton of new homeowners stuff, but I have acquired a ton of new tools (consignment tool shops are the best place ever). Thankfully, I grew-up in a very handy family so I’m not totally in the dark when it comes to home improvement and these tools come in handy. I’ve learned that not every project needs every tool. Before I start a project I scope out what I need to get done, load up my tool belt and get to work. I don’t haul the entire toolbox (or toolboxes) to the project each time.

My tool belt is a wonderful thing. It is lightweight, I only load up what I need for the specific project, and it and forces me to think about my project and make the right planning decisions.

I see so many parallels between my tool belt project approach and what I try to do as a geo-professional.

In the spatial world we often get tied to the idea of the toolbox(es) when working on analysis projects. Toolboxes, whether geo-toolboxes or regular toolboxes, are often full of tools one doesn’t need for a specific project, and sometimes they can be full of tools we use improperly (how many of us have actually used Kriging in the right context or tried to use a flat head screw driver as a chisel?). Without proper planning – planning out a project before you even start – may cause one to use tools in their toolbox incorrectly, perhaps coming to less than a correct conclusion.

We, as geo-professionals, will be much better at what we do if we learn how to solve the problems and answer the questions related the projects we work on first, instead of trying to know how to use every tool in our toolbox. Yes, there will always be the plumbers, contractors, and electricians who have every tool that there could ever be related to their job, just as there will be those all-knowing GIS gurus. However, the vast majority of geo-professionals are those who do other things and not “all GIS, all the time.” I really believe that by using the tool belt approach we can develop a better class of geo-professionals. Understand your problem, do the research to solve it, and then load your tool belt with the proper tools to solve it. And, good, detailed geospatial analysis like good, detailed home improvement never goes as fast as it does on HGTV.

Now, where did I put my hammer?

Spatial SQL – Multi-Point to Line Example

I have been using Spatial SQL for a while now.  I like it.  A few lines of code can do a lot of analysis or data processing.  I’ve covered a number of basic topics but there are always more to do.  Here is a script to take a series of points and convert them into a single line.   This script will use a few SQL commands, including using a cursor, developing a linestring, and STLineFromText.

The sample data comes from NOAA and the National Hurricane Center. The points represent some sample tropical cyclone forecast points for Hurricane Sandy.

The basic idea of the script is to link a set of points together using a common attribute using a cursor, combine the coordinate pairs into a line string, and use the  STLineFromText method to convert the coordinate pairs into a single line.  The script works pretty well, but since I am using a cursor it can slow down with larger (a few hundred thousand rows) datasets. A good SQL programmer probably wouldn’t use a cursor here since they can be slow and cumbersome to use.  In fact, I’m sure a good SQL programmer wouldn’t use a cursor.  I am investigating ways to not use a cursor, so if you have a suggestion let me know!

The sample script includes a sample dataset that is available here.  Take a look at the script.  If you have any suggestions to make this script faster or more efficient let me know.

/*#################################################

Script Name: multi_points_to_Line.sql
Purpose: This script will take pairs of coordinates
 of the same line and convert them into a LineString 
that can be used to generate lines of the geometry 
data type. User will need to update the database, 
tables, and column names relevant to their own analysis.

Sample Sandy data tracks represent five day
models from the National Hurricane Center.

Prepping the data - The user will need to download 
the following file and load into their SQL database:

http://www.gisdoctor.com/downloads/Line_Parts.txt

Here is a quick script to take the text file and load 
it into a table generated for this exercise:

create table Spatial_Database.dbo.Distinct_Points
([ADVISNUM] varchar(3), [lat] float, [lon] float, 
[MaxWind] int)

BULK INSERT Spatial_Database.dbo.Distinct_Points
FROM 'Path to Line_Parts.txt file'
WITH (FIELDTERMINATOR =',',FirstRow = 2);

###################################################*/
 
--Set the database to process in
use Spatial_Database
--Drop temporary table
drop table #Sandy_hur_tracks
--Create new temporary table
create table #Sandy_hur_tracks
([EventID] int, [line] geometry)

--Declare cursor variable
DECLARE @eventID varchar(10)
--Declare text string that will store coordinate pairs to
--populate the LineString
DECLARE @coordString VARCHAR(MAX)

--Initialize the cursor using the ADVISNUM column
DECLARE db_cursor CURSOR FOR
select distinct ADVISNUM
from Spatial_Database.dbo.Distinct_Points
order by ADVISNUM asc

OPEN db_cursor
FETCH NEXT FROM db_cursor INTO @eventID

WHILE @@FETCH_STATUS = 0
BEGIN

-- Clear the coordinate string with each iteration of the 
-- cursor - otherwise the coordinate string will 
-- append itself each time
set @coordString = ''
--collect all coordinate pairs and add them to a single row. 
-- Coordinate pairs are separated by a comma.
select @coordString = (COALESCE(@coordString + ', ', ' ') + 
(cast(Lon as varchar) +' ' + CAST(lat as varchar)))
FROM Spatial_Database.dbo.Distinct_Points
WHERE ADVISNUM = @EventID

--Insert the eventId and coordinate pairs into the table.         
--Coordinate pairs string is used to build the LineString to      
--create the line geometry
insert into #Sandy_hur_tracks
select @eventID as EventID,
Geometry::STLineFromText('Linestring 
(' + right(@coordString,LEN(@coordString)-1) + ')' 
, 4326) as line

FETCH NEXT FROM db_cursor INTO @eventID
END
--Close and delete the cursor
CLOSE db_cursor
DEALLOCATE db_cursor

--Select results from the temp table.
use Spatial_Database
select * from #Sandy_hur_tracks

The Basics

What are our geo-analysis fundamentals?

Fundamentals should be conceptually simple, so that one can learn them and understand them quickly and easily.  Lately, three basic fundamentals of geo-analysis have been ringing in my head and I think anyone who works in “spatial” should really understand them.  Here they are, in no particular order:

If geo-analysis is your area of expertise, you should be able to discuss all three topics with some intelligence.  I know there are many more fundamentals that build the foundation of geo-analysis, but these are the three that have been thinking off lately.  Do you have any other geo-analysis fundamentals that you think are crucial to know?  If so, leave a comment.

Geo Ideas I Want to See More of in 2013

I recently wrote about the geo-terms I wanted to retire in 2013.  However, there are a few topics I want more of in 2013.  The term I want to see more of in 2013 is “open” and here is what I was thinking…

Open Source –  The open geo-software community had a great 2012.  I really see this momentum continuing to grow in 2013.  The key to continued adoption (beyond great software, easy to use platforms, and continued innovation)? Get open geo-software into academia.  The more undergrads who learn GIS on Quantum, GRASS, PostGIS and the rest, the more this movement will continue to expand.

OpenStreetmap – Recently Openstreetmap hit 1 million users.  As a somewhat semi-regular contributor I see great promise in OSM but OSM can’t end up like Wikipedia, which is losing editors and contributors.  OSM can never be completed, and the army of volunteers will hopefully see that.  I should probably do some mapping this weekend!

Open Analysis – I would love to see the the geo-community become more open with analysis. This could include sharing analysis techniques, working together to develop new analyses, or helping the world understand geospatial analysis.  A map is far more than the visualization of the abstraction of space. Let’s start promoting the science of the understanding of patterns in space!

Hoorary open geography! Hooray 2013!

Geo Terms I Want to See Disappear in 2013

Geo/spatial/location/GIS is everywhere now-a-days.  That is awesome.  No longer is what we do a specific niche that is only found in a small set of industries.  Openstreetmap, location aware devices, dropping pins, Google maps – everywhere you look geo/spatial/location/GIS matters.  Heck, even Gizmodo has a “Maps” tag.

This ubiquity is both a blessing and a curse.  Thanks to the every growing understanding of what we collectively do there has been some abuse of a few keywords throughout the geo-world (some of which I am guilty of).  For 2013 I think we should retire a few terms to keep us (me) sane.  Here is my short list.

1. Heatmap -Heatmaps are one of my least favorite cartographic representations of data across space.  I love density maps, choropleth maps, and interpolated surfaces, but misrepresenting data for the sake a cool map is a giant pet peeve of mine.  Let’s make a conscience effort in 2013 to stop people from using the term heatmap to describe any map with bright colors on it.

2. Cloud – We get it. Enough already.  To the Cloud!

3. Analytics – Overused and abused term #3.  What are you actually analyzing? I love identifying and understanding patterns across space, it’s what I do everyday, but let’s lay off using the term analytics to represent any type of math or stats done on a spatial dataset. To me analytics involve higher level operations, whereas I think people often use the term to represent basic stats.

4. Big Data – You have big data, I have big data, we all have big data.  Question.  What is big data?

These opinions are mine and mine alone.  Are there any geo related terms that you think have been overused in 2012 and need to be retired in 2013?  Leave a comment.  This could be fun.


More Spatial SQL – Calculating Lines between Points

Recently I posted some tips and example script to measure distance between points using SQL Server.  The obvious extension of this script would be to generate the lines between two points. I wanted to create a script that took two points from a table and using STLineFromText to create the line. The vast majority of the script is the same as the previous post, with the exception of the line to create the lines.  So, here it is:

select 
t1.Id as ID, 
t1.NAMEASCII as t1_Name, 
t1.SOV0NAME as t1_SOV0NAME, 
t1.Latitude as t1_Latitude, 
t1.Longitude as t1_Longitude, 
t2.ID as t2_ID, t2.NAMEASCII as t2_Name, 
t2.SOV0NAME as t2_SOV0NAME, 
t2.LATITUDE as t2_Latitide, 
t2.LONGITUDE as t2_Longitude,
Geography::Point(t1.Latitude, t1.Longitude, 4326).STDistance(Geography::Point(t2.LATITUDE, t2.LONGITUDE, 4326)) as Distance_Meters,
Geography::STLineFromText('LINESTRING('+cast(cast(t1.longitude as float)as varchar)+' '+cast(cast(t1.latitude as float)as varchar)+','+cast(cast(t2.longitude as float)as varchar)+' '+cast(cast(t2.latitude as float)as varchar)+')', 4326) as line
from dbo.Populated_Places t1 cross join dbo.Populated_Places t2
where t1.SOV0NAME = 'United States' and  t2.SOV0NAME = 'United States'  and t1.ID != t2.ID and t1.NAMEASCII = 'Boston'

A few notes about this script:

  • I am using SQL Server 2008 R2.
  • Unfortunately, you cannot pass values directly into the STLineFromText method like you can other Spatial SQL methods.  When using the STLineFromText the user needs to convert the coordinate pairs into a LineString.  This isn’t that big of a deal since the LineString allows a users to string together a series of coordinate pairs to create complex line objects, which is a big plus (in this example I am creating lines between two points), I had to use a cast a couple times to get the coordinate data in the correct format.  I experimented with a couple different ideas and this one worked.  This probably isn’t the best way to do this so if you have a better idea please post a comment!
  • The line that is being generated is a geodesic line.  Why is that?  I am using the Geography data type and I am calling an SRID of 4326 when STLineFromText is executed.  The combination of the two will create “near” geodesic lines as opposed to planar lines.
  • Like in the previous post, a self cross join is being used to create the location pairs.
  • There are a couple items in the where statement that need to be mentioned.  The query above will not work if the coordinate pairs represent the same location, meaning STLineFromText cannot create a line where the two points represent the same space.  To prevent this error I simply set the query to not select IDs that are equal.  The results of this query return the distance and generates a line between all populated places in the United States from Boston.  To prove this works, here is a nice little image:

Lines between Points
Ok, that’s it.  Pretty simple and pretty fast (the example query takes two seconds to run). Perhaps I’ll put together a simple script to string together multiple points into a line or multi-line object next!

Spatial SQL for the Geographer – STDistance Example

When I put together the Spatial SQL for the Geographer posts I never wrote anything about measuring distance.  Geographers often need to know the distance between locations, as distance decay is one of those things we find important.  Fortunately for us, measuring distance between points is pretty easy using Spatial SQL (and pretty fast).  The following query demonstrates an example of measuring distance between a set of defined points from the populated places data available in the sample data.

select 
t1.Id as ID, 
t1.NAMEASCII as t1_Name, 
t1.SOV0NAME as t1_SOV0NAME, 
t1.Latitude as t1_Latitude, 
t1.Longitude as t1_Longitude, 
t2.ID as t2_ID, t2.NAMEASCII as t2_Name, 
t2.SOV0NAME as t2_SOV0NAME, 
t2.LATITUDE as t2_Latitide, 
t2.LONGITUDE as t2_Longitude,
Geography::Point(t1.Latitude, t1.Longitude, 4326).STDistance(Geography::Point(t2.LATITUDE, t2.LONGITUDE, 4326)) as Distance_Meters
from dbo.Populated_Places t1 cross join dbo.Populated_Places t2
where t1.SOV0NAME = 'United States' and  t2.SOV0NAME = 'United States'

You will notice that in the query a few different things are happening:

  • A self cross join is used to take each record and join it to every other record.  This is done to get the lat/long combo for each city and matched up with every other city.  There is probably a better way to do this, but for this example it works.
  • In order to calculate distance two points are generated on the fly from the columns by calculating the point with Geography::Point(LAT, LONG, SRID).  Setting the SRID is important, as that will impact the measurement.  More often than not the user will be using an SRID of 4326 (WGS84), unless they are using projected data.  For more info on SRIDs check out this handy Wikipedia article.
  • You could replace Geography with Geometry when generating the points.  Doing so would lead to vastly different measurement results because of the way distance is calculated on the plane or on the spheroid.  When using the Geography data type the distance results are returned in meters while with the Geometry data type the results are reported in decimal degrees.
  • Once the points are created on either side of the STDistance method the query can be run.  The documentation provides a couple notes about using STDistance. The SRIDs need to match between the points and there is some error involved when measuring distance.  The distance measurement error is important to understand if one has tight tolerance they need to adhere to.

The results of this query will return a set of columns with the measurement in meters from every record to every other record for US cities.  With some additional coding you can generate a distance matrix, find the nearest locations, or create line features between points pretty quickly.  This query can also go pretty fast, if the proper indexes are generated and called in the query it should take less than a minute.  Not to bad when returning over 600k records.